The Interactive Dashboard for Admin
Admin Dashboard

Team Vizman
Last Update pirms 4 gadiem
The admin can access the company dashboard, which includes some charts, statistics, and graphs, after completing the settings. The toggle button at the top of the page allows the admin to view his or her employee dashboard. Simply by switching, the admin will be taken to his or her dashboard, where they can add visitors to meetings, take significant action, and examine the calendar for meetings.
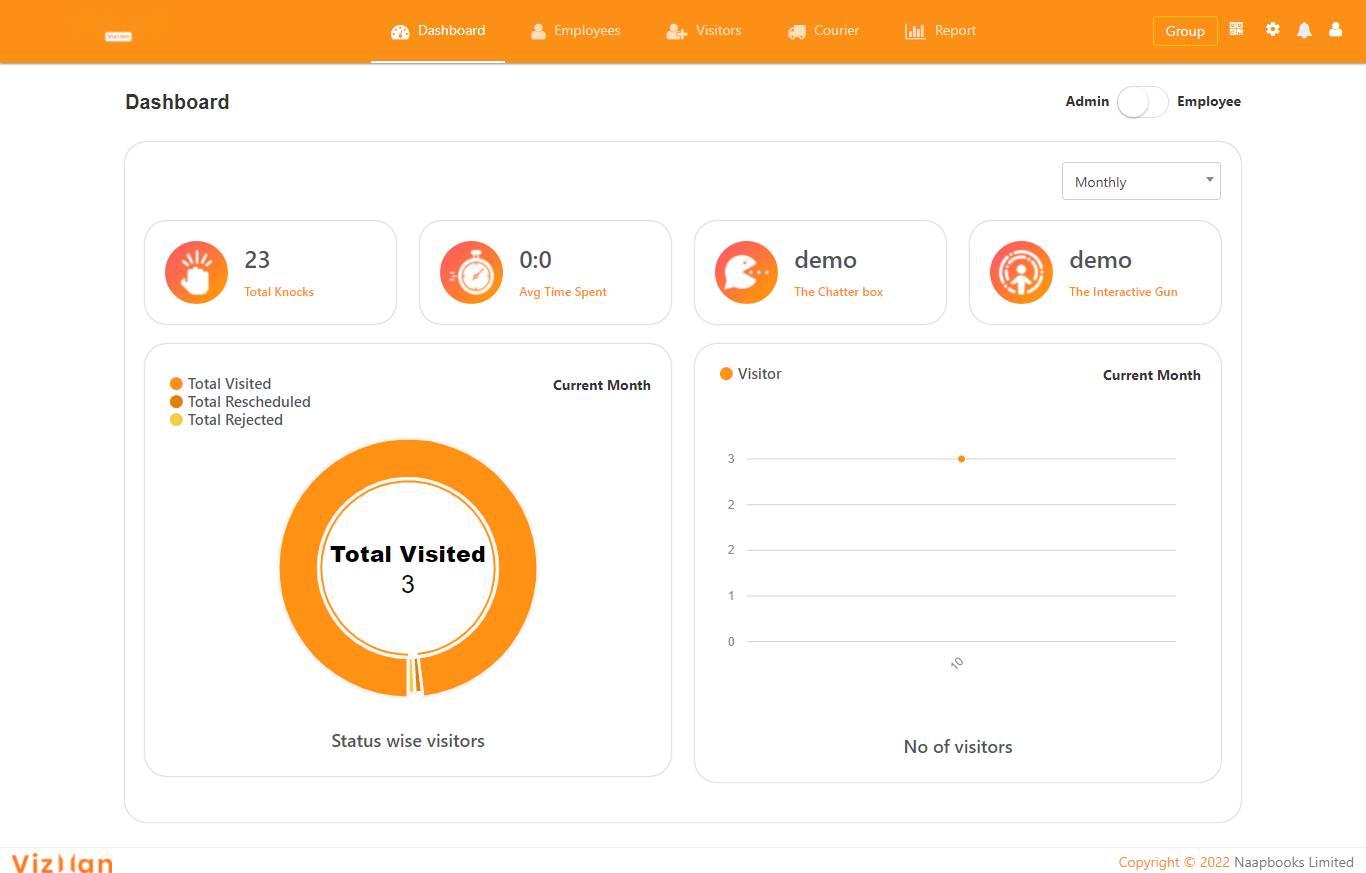
The Interactive Dashboard statistics
Here are some interesting counters to work with:
1. Total Knocks: This will tell you how many people have visited the company.
2. Avg. Time Spent: This counter will display the average amount of time visitors spend on the premises.
3. The Interactive Gun, which reveals who has the most meeting hours.
4. The Chatterbox: This statistic will tell you which employee has the highest number of visitors.
These counters are filtered by period, such as monthly, quarterly, and annually
The Charts
The dashboard displays two graphs: one depicts visitors by status (represented by a doughnut chart) and the other depicts visitors by date (represented by a line graph).